A brief introduction…
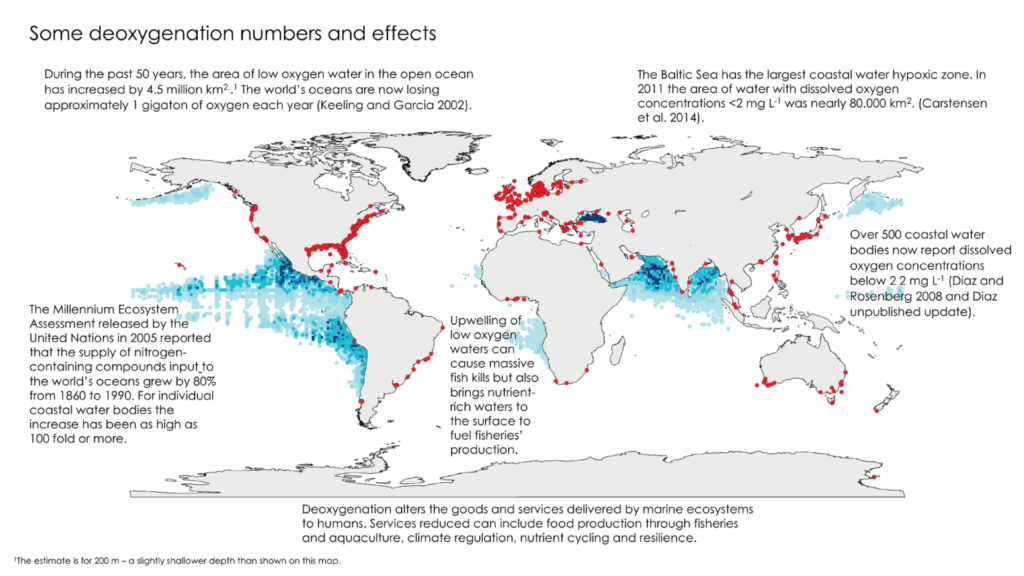
Oceans deoxygenation is considered one of the most important threats currently occurring in marine ecosystems, as the oceans have lost about 2% of their oxygen inventory over the last 50 years. However, the impact of deoxygenation is not only happening in oceanic zones, hypoxic and anoxic coastal zones are also increasing. To get an idea of the areas of low oxygen content, here is a global map from Breitburg et al. (2018). The red dots refer to hypoxic coastal zones (dissolved O2 content < 60 µmol O2 kg-1), while the shaded blue areas represent oxygen minimum zones (OMZs).
Consequently, microorganisms have to face these decreasing oxygen conditions, but how do they do it?
Aerobic respiration is carried out by terminal oxidases, a group of enzymes that play a key role in the final stage of aerobic respiration. There are two groups of terminal oxidases: low and high affinity terminal oxidases (LATO and HATO), with a half-saturation constant (Km) of 200 nanomol L-1 O2 and 2-8 nanomol L-1 O2, respectively. In contrast to eukaryotes that only possess low-affinity terminal oxidases, prokaryotes have both high- and low-affinity terminal oxidases. Prokaryotes can use both types during aerobic respiration to modulate their affinity for oxygen, and therefore, adapting to decreasing oxygen conditions.
Michaelis-Menten kinetics model (picture below) can be used to study the effect of oxygen concentration on respiration rates and thus, the microbial performance under these decreasing oxygen conditions. The kinetics parameters, maximum respiration rate (Rmax) and half-saturation constant (Km), offer insights into the relative use of different oxidases and overall adaptation strategies employed by microorganisms.
As the extension and distribution of low-oxygen zones are increasing, their impact on global biogeochemical cycles needs a deeper understanding of microbial processes. Therefore, aerobic respiration kinetics in environments with large oxygen gradients will help us better comprehend the distribution of microorganisms and their microbial processes occurring at the boundary of oxic-anoxic conditions.
Oxygen Minimum Zones: an overview
Oxygen minimum zones are systems where sinking of organic matter produced by primary production at the surface coupled with slow water circulation leads to the formation of oxygen-deficient water masses. The strong stratification observed in tropical areas allows these OMZs extend over vast regions, covering over 30 million Km2, which means 8% of the total ocean surface. This highlights the significant role of these zones on shaping the inhabiting marine ecosystems and biogeochemical cycles but, how?
OMZs play an essential role in the global nitrogen cycle, involving several chemical species and different bacteria processes. OMZs are associated to denitrification, a process that only occurs in oxygen-deficient regions. This process convert nitrate (NO3–), one of the main nutrients in the ocean, into gaseous nitrogen (N in the form of molecular nitrogen, N2, or nitrous oxide, N2O), which is lost to the atmosphere and contributes to the oceanic nitrate deficit.
OMZs are not only involved in the nitrogen cycle, but also in another biogeochemical processes like the production of production of sulphide (H2S) and methane (CH4), and limitation of atmospheric CO2 sequestration by the ocean.
However, the impact of OMZs extends to biodiversity, as this oxygen-deficient zone can serve as a refuge from predation for organisms specially adapted to these oxygen levels.
For this reason, OMZs are crucial for studying aerobic respiration kinetics. This natural gradient of oxygen concentrations allows us to investigate and study how different microbial communities adapt to different oxygen levels within the water column. By mimicking these gradients in controlled incubations, we can observe how respiration rates change across different oxygen concentrations, making OMZs a natural laboratory for understanding aerobic respiration kinetics.
Study of aerobic respiration kinetics
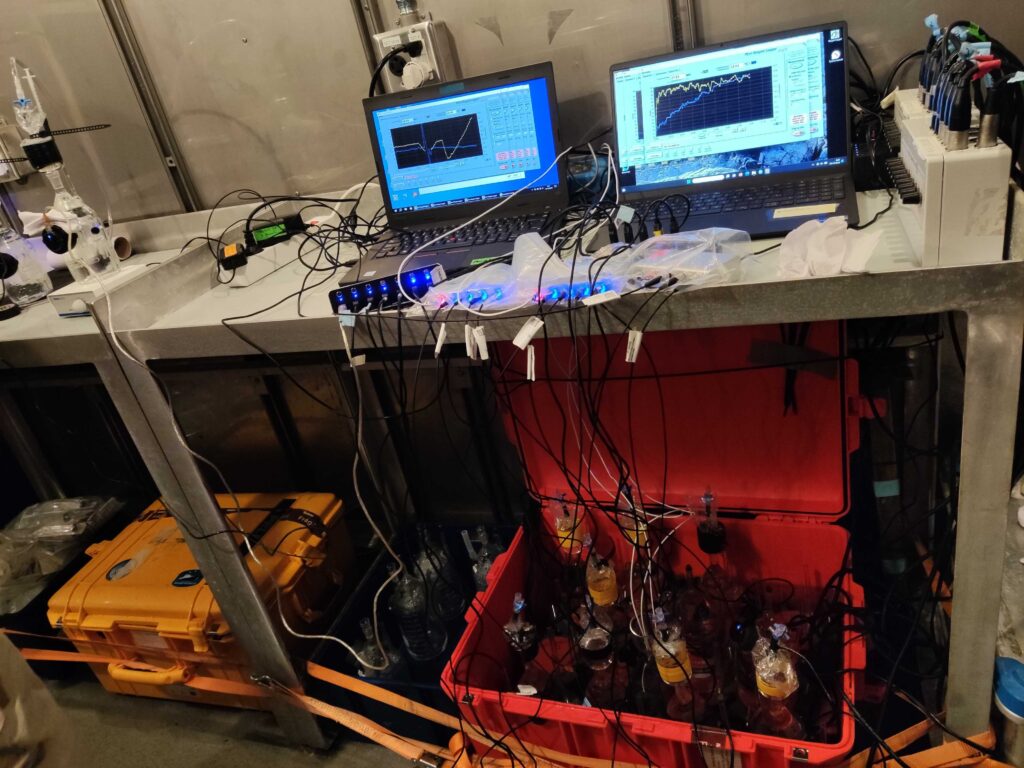
In order to measure the respiration kinetics, we perform a series of incubations in modified glass bottles. We monitor and follow the oxygen concentration throughout incubation time with a set of high-resolution oxygen sensors to measure oxygen consumption rates from anoxia to full oxygen saturation. The incubation bottles are kept in dark and placed in a temperature-controlled bath. The set-up of the experiment is shown below to the right.
Using the changes in the oxygen concentration during the incubations, we can calculate the respiration rates from linear regression of O2 concentrations over time in the different bottles with different oxygen concentration levels. We then use all the respiration rates measured at the different oxygen concentrations for fitting the Michaelis-Menten model and characterize the respiration kinetics of the microbial community, as we can see in the following graph.
The points in the graph represent the respiration or oxygen consumption rates across the wide range oxygen concentration used, from very low oxygen values to almost full oxygen saturation. For a better visualization of this wide range we also show the same data but using logarithmic scales on both oxygen concentration and respiration axes, showing the fitting of the data to the Michaelis-Menten model across the wide range of oxygen concentrations used.
The work behind the incubatios
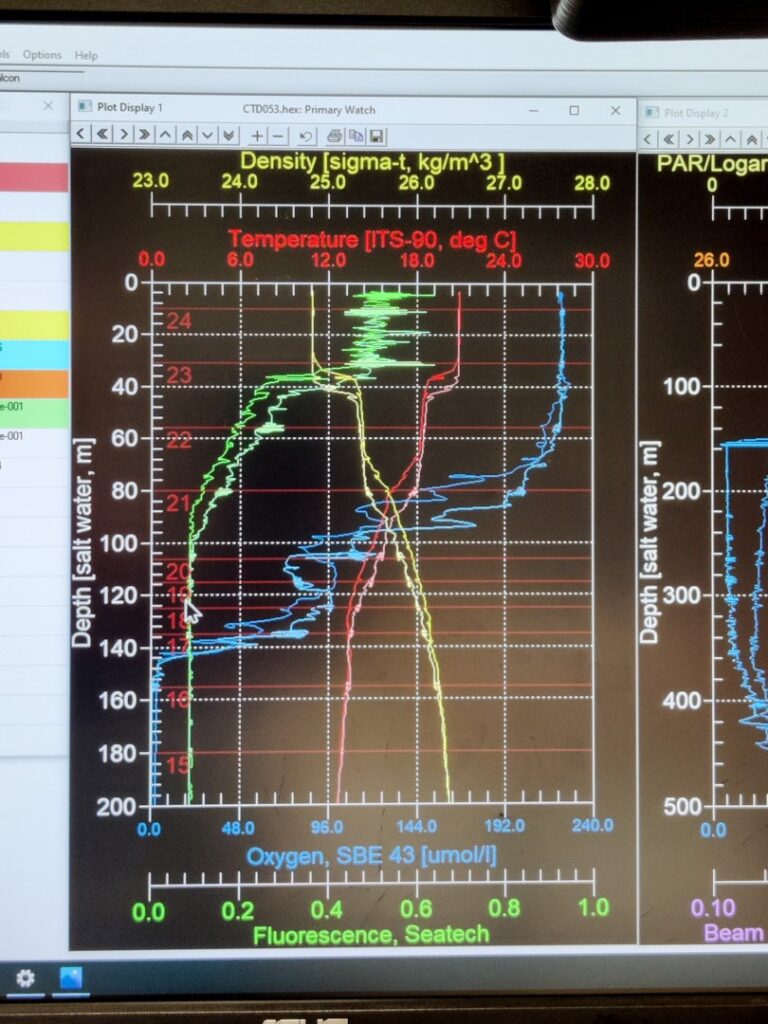
Prior to running the incubation experiments, is essential to understand the water column’s physical and chemical characteristics. For that purpose, we use a conductivity-temperature-depth sensor, more known as CTD. This instrument is widely used in oceanography to characterize the changes of conductivity and the temperature with depth. Modern CTDs are also equipped with additional sensors to measure and collect data from other parameters like oxygen, fluorescence (indicative of phytoplankton activity), turbidity, etc.
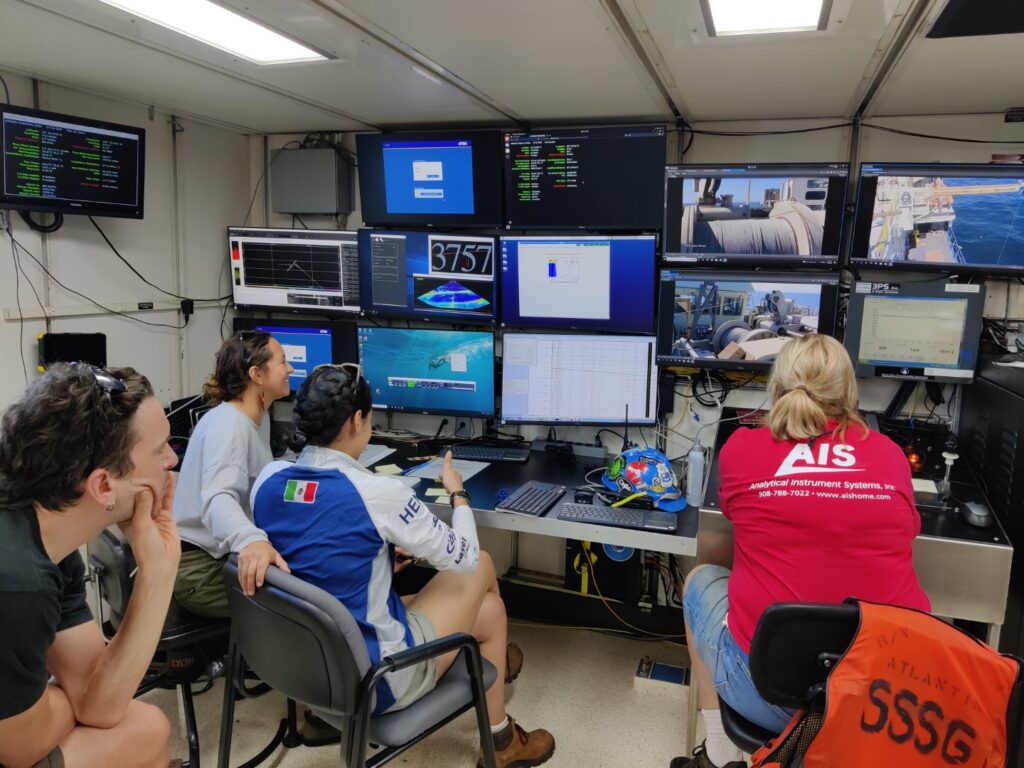
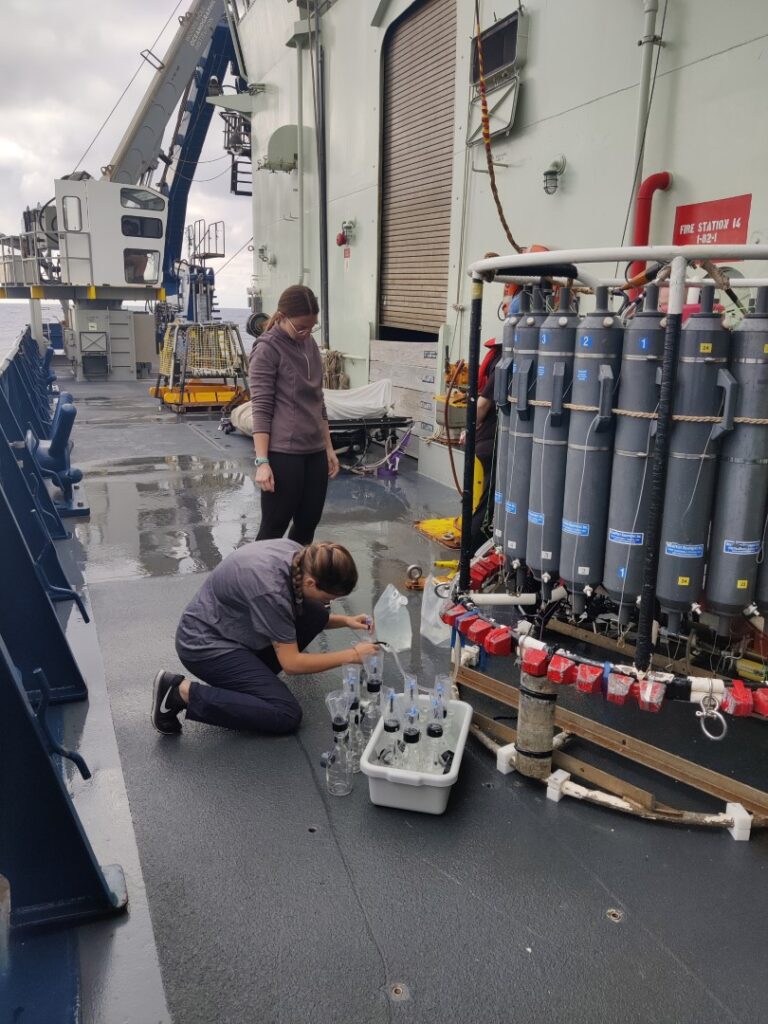
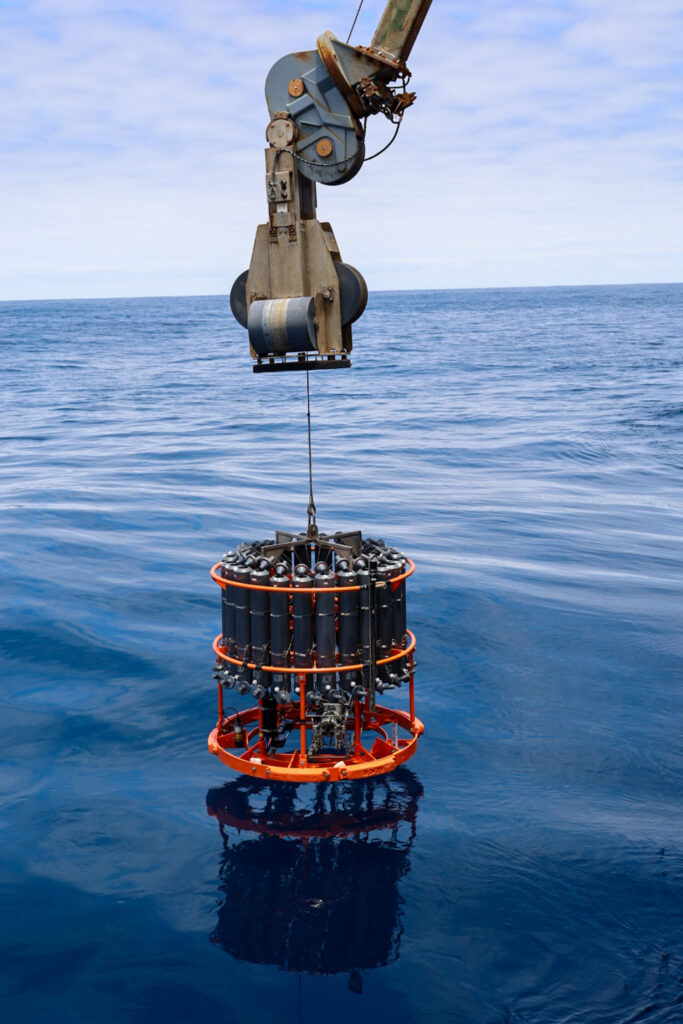
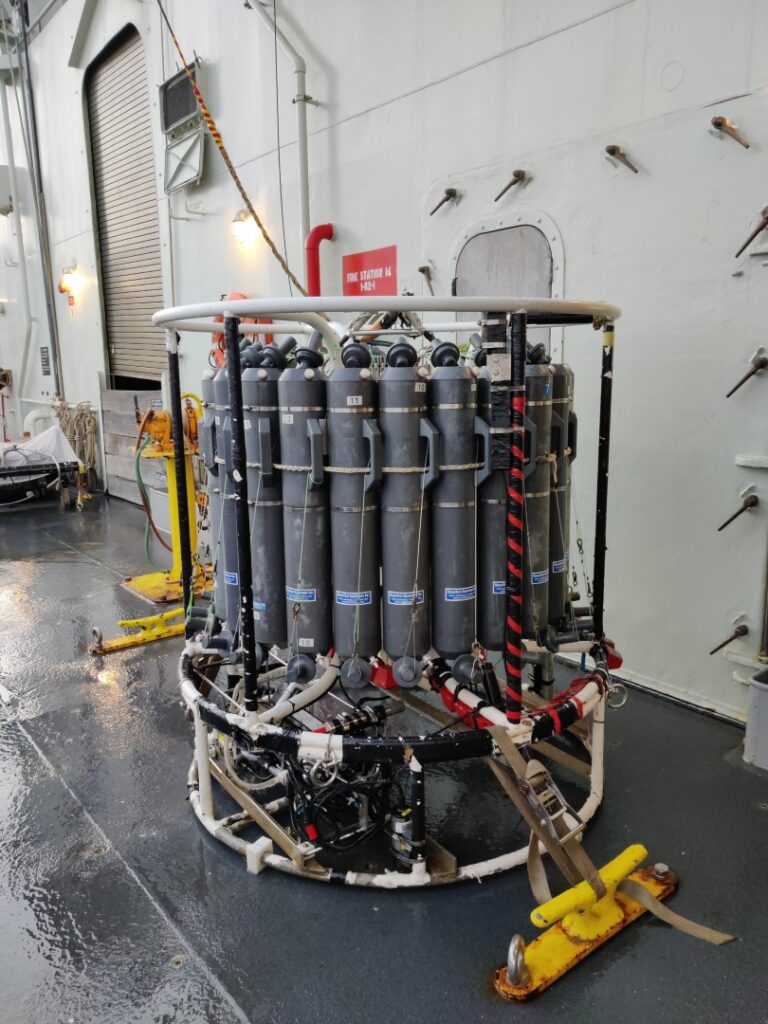
The CTDs are attached to a metallic structured called rosette, which holds a bunch of sampling water bottles that are used to collect water from different depths. These bottles can be controlled remotely from a control room, where scientists receive live data from the CTD and can monitor changes in the physical and chemical characteristics of the water mases as the rosette descends. Once the rosette returns to the surface, bottles can be closed remotely at the selected depth. Here is an example: a rosette from the R/V Atlantis (Woods Hole Oceanographic Institutions, Massachusetts, E.E.U.U.). This rosette is composed by 24 sampling water bottles of 12 L each. However, the number and size of bottles can vary depending on the specific rosette design and research requirements. The CTD sensor is placed below the set of bottles. As a safety measure, the rosette is always securely tethered to the floor.
The process of the CTD deployment and recovery can be carried out by the scientific team on board with guidance and indications of the technical staff, or remotely controlled by a technician, as it’s shown in the pictures below. On the other hand, scientist receive the real-time data from the CTD sensors and the other sensors associated, obtaining the water column profile. Based on that, scientist make decisions regarding the following experiments and samples collection. Once the rosette is back to the surface and secured, water is directly collected from the bottles, as they have a spout for easy retrieval by directly connecting a tube. The success of samples collection lies on collaboration between scientist and the technical staff!


